
Multitemporal SAR images change detection
To mining different change profiles, we propose several methods to detect the change area, change magnitude, change classes and change time of multitemporal SAR images.
This work is supervised by Florence Tupin, Henri Maître and Loïc Denis.
1. Change area detection
Based on RABASAR provided data which have spatial varying ENL, we propose a simplified generalized log-likelihood ratio test (SGLR) method assuming that corresponding temporal pixels have the same equivalent number of looks (ENL). During the test, chi-squared probability distribution function is utilized to theoretically define the false alarm rate.
To compare with the state-of-the-art change detection methods, we processed popular used TerraSAR-X images acquired over Sendai. The changed areas in the images mainly have large magnitude changes. 9 temporal well-registered images are used for the preparation of denoised data, both for 2SPPB method and for RABASAR method. Only two images which were acquired in 06/05/2011 and 08/06/2011 are used for the change detection.
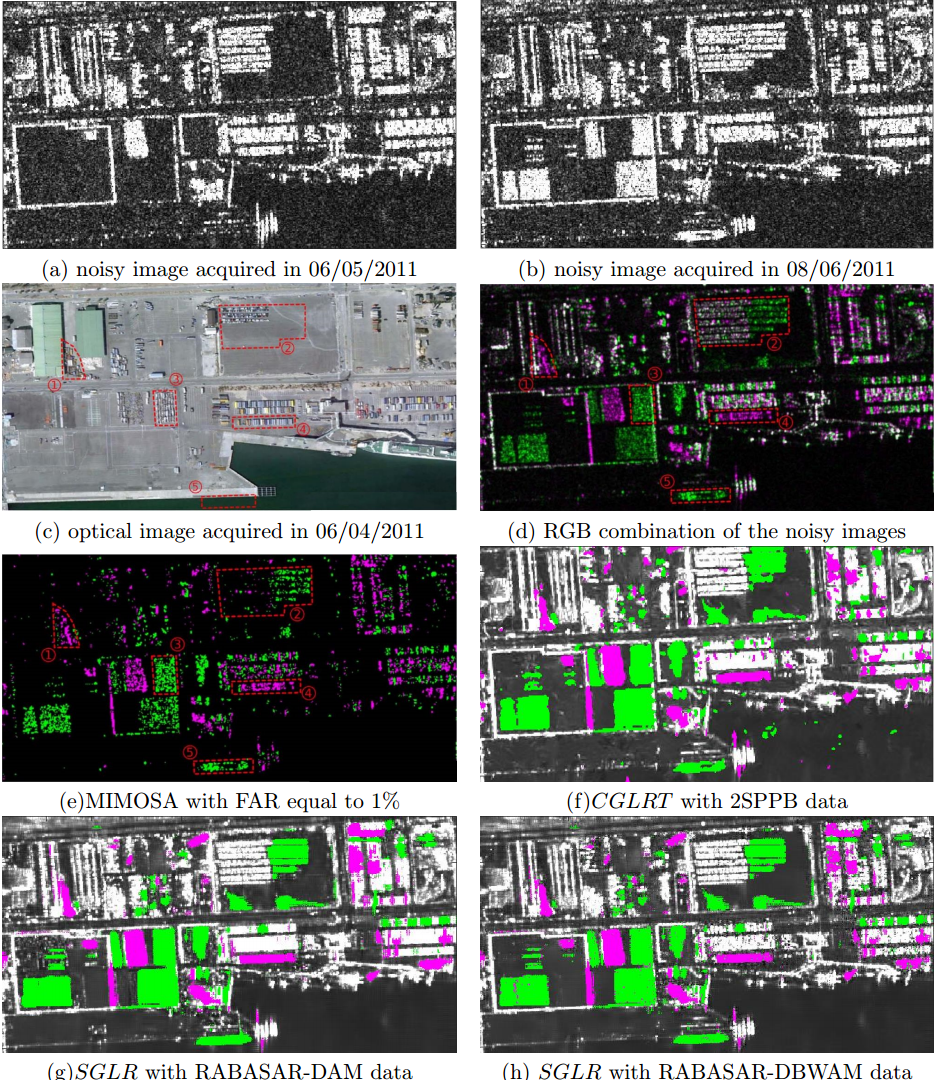
Figure 1. Sendai SAR image pair change detection comparison. (a) noisy image acquired in 06/05/2011, (b) noisy image acquired in 08/06/2011, (c) optical image acquired in 06/04/2011, (d) RGB combination of the noisy images, (e) MIMOSA detection results with a priori FAR equal to 1%, (f) CGLRT detection results with 2SPPB data, (g) SGLR detection results with RABASAR-DAM data, (h) SGLR detection results with RABASAR-DBWAM data.
2. Change magnitude detection
To distinguish appearing and disappearing changes, we used a signum function sign(x) to convert SGLR values to corresponding positive values when x > 0 and negative values when x < 0. In this case, if we set the image acquired at time t as the reference image, the positive and negative values correspond to the increase and decrease of the object backscattering values.
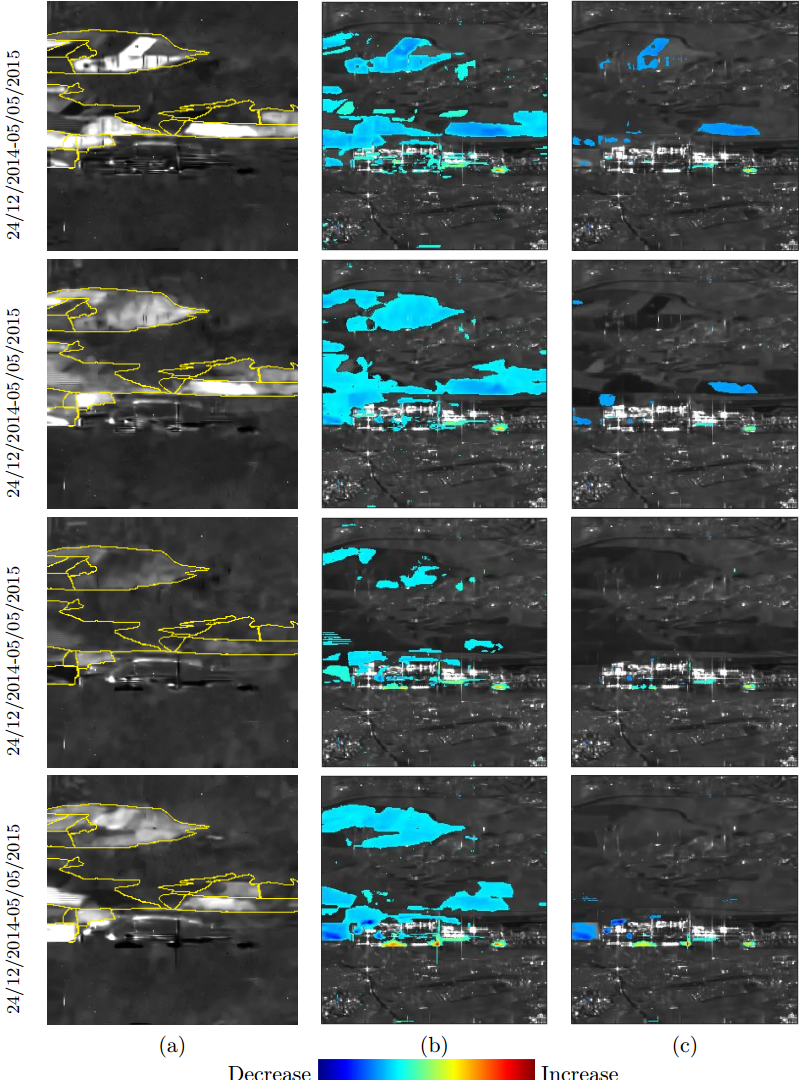
Figure 2. Cumulative change detection results. (a) ratio image between two different date, (b) cumulative changes without object weights, (c) cumulative changes with object weights which are used to suppress farmland area changes. The thresholds chosen for column (b) with Pfa=0.54% and Pfa=1% for column (c). The farmland areas boundaries are index using yellow line which is prepared manualy. The time intervals of the changes are shown above. Different colors represent the decrease and increase of the backscattering values. The temporal images are denoised using RABASAR-DAM method.
3. Change type classification
During the time series acquisition, the changes may occur multiple times and in different change magnitudes. To detect the change types, we propose an improved change classification method inspired by NORCAMA method [Su et al., 2015] and spectral clustering method [Shi and Malik, 2000, Ng et al., 2002]. In practice, the change types are transferred into a partitioning problem and detected using spectral clustering.
The proposed method is similar to normalized cut method [Shi and Malik, 2000, Su et al., 2015]. However, they normalize the rows of symmetric change criterion matrix A(s) to sum to 1 and use its eigenvectors instead of the normalized Laplacian matrix. In addition, they do not re-normalize the rows of U (the k largest eigenvalues) to unit length [Ng et al., 2002].
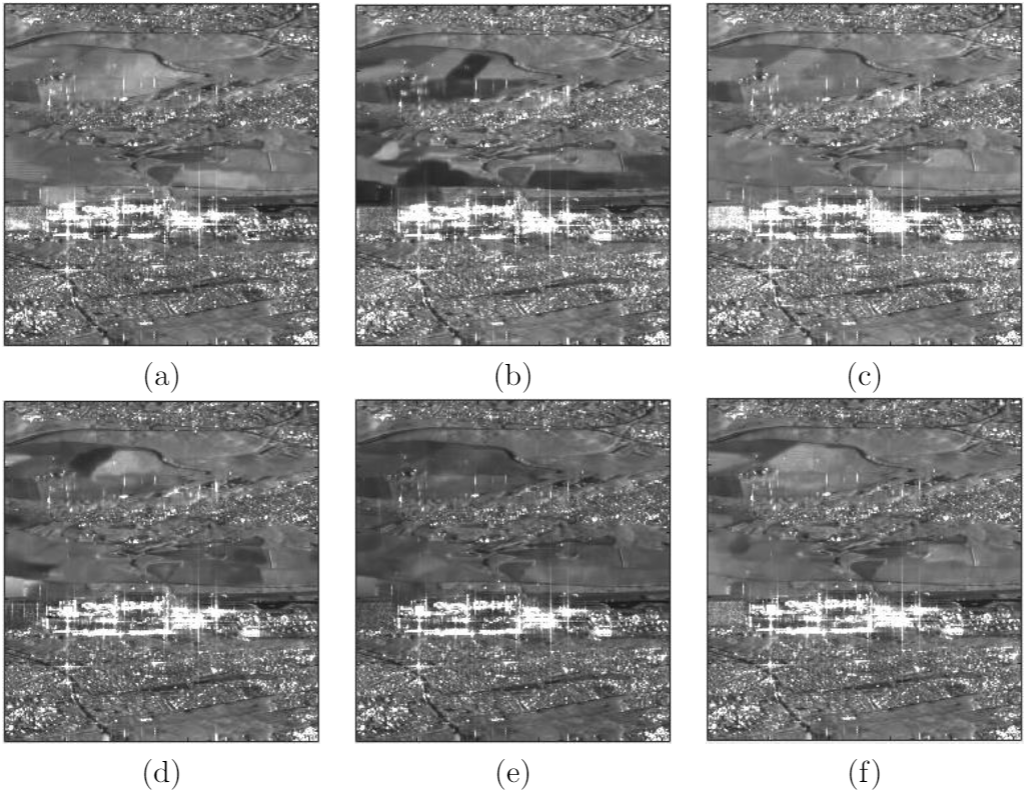
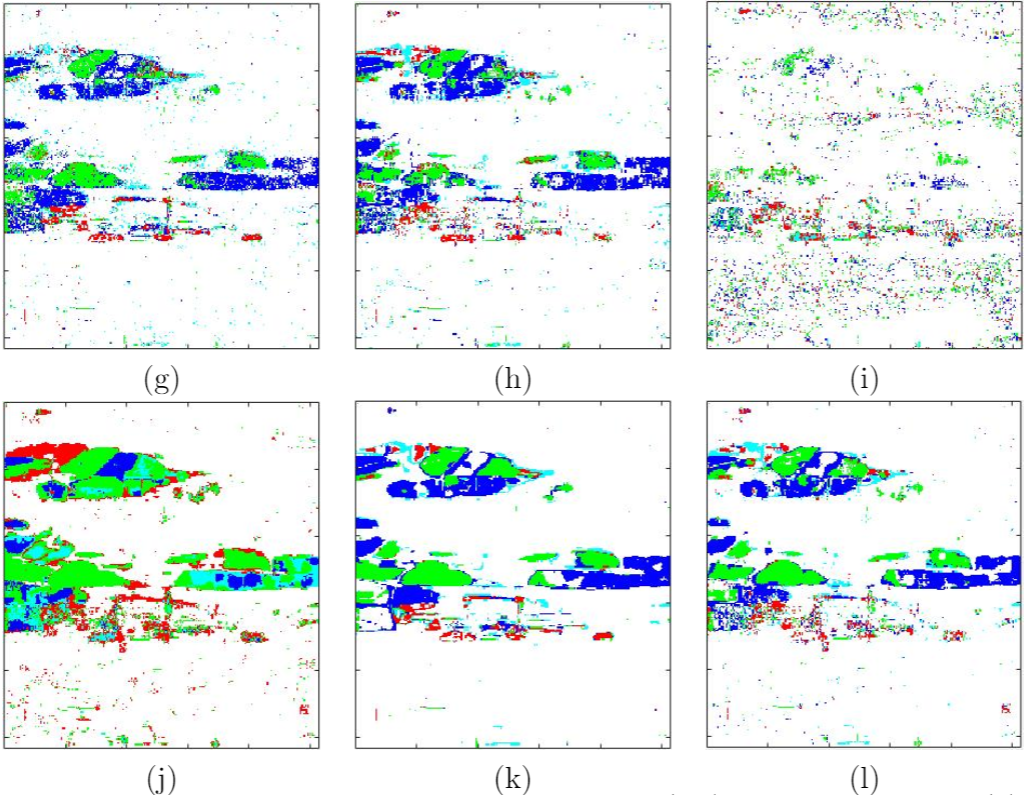 Figure 3. Sentinel-1 time series change classification. (a-f) RABASAR denoised Sentinel-1 images, (g) NORCAMA with RABASAR-DAM provided data, (h) NORCAMA with provided RABASAR-DBWAM data, (i) NORCAMA with 2SPPB provided data, (j) Conradsen’s with RABASAR-DBWAM provided data, (k) SGLR with RABASAR-DAM provided data, (l) SGLR with RABASAR-DBWAM provided data. 6 images are used for the change type detection. The change type results are: white: no change, red: step change, green: impulse change, blue: cycle change and cyan: complex change.
4. Change time detection
Change time detection is significant for land surface monitoring. Normally, changes may represent transitions that occur between states [Aminikhanghahi and Cook, 2017]. Currently, REACTIV method [Koeniguer et al., 2018] is a simple and high efficient time series change detection algorithm. It is based on HSV visualization space and exploits only time domain estimates without any spatial estimation. The principle of the method is to exploit the HSV color space, where the hue channel H represents the time, the saturation channel S is coding the temporal coefficient of variation, and the value V corresponds to a notion of conventional radar intensity.
However, the detection results are highly corrupted by its speckle noise. Even using some state-of-the-art denoising methods, the bias estimation in vegetation area still prohibit REACTIV provide the best performance. In addition, the color in REACTIV results represent the appearing date of maximum intensity values which can not indicate the change times.
We improved REACTIV method with RABASAR denoising results. In addition, we will use the generalized likelihood ratio test to detect the change starting and ending time, the maximum change magnitude time and the maximum change significance time.
We have applied the proposed method to flooding area monitoring.
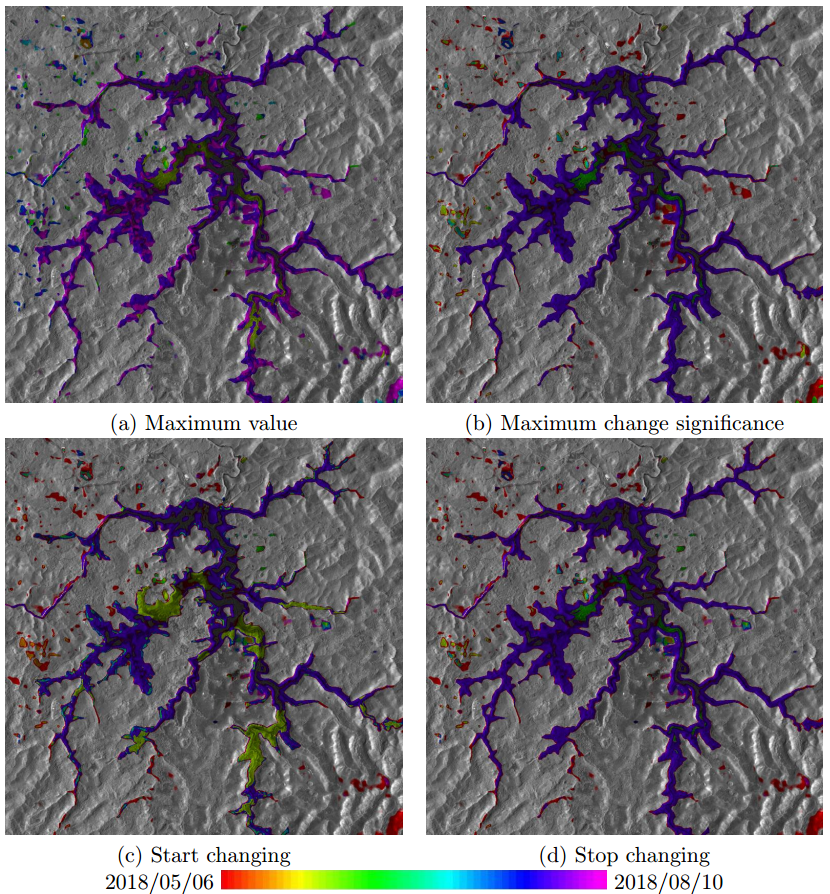
Figure 4. Flooding area change time detection comparison with 9 Sentinel-1 GRD data. The images are acquired over Xe-Pian Xe-Namnoy dam in the southeastern province of Attapeu in Laos. 87 temporal Sentinel-1 GRD images are used for the preparation of the arithmetic mean image. All the test images are provided by RABASAR-AM.
The detection results have high similarity with the results provided by ESA (https://www.esa.int/Our_Activities/Observing_the_Earth/Copernicus/Sentinel-1/Sentinel-1_maps_flash_floods_in_Laos).
References
[1] Su, X., Deledalle, C.A., Tupin, F. and Sun, H., 2012, July. Two steps multi-temporal non-local means for SAR images. In Geoscience and Remote Sensing Symposium (IGARSS), 2012 IEEE International (pp. 2008-2011). IEEE.
[2] Su, X., Deledalle, C.A., Tupin, F. and Sun, H., 2015. NORCAMA: Change analysis in SAR time series by likelihood ratio change matrix clustering. ISPRS Journal of Photogrammetry and Remote Sensing, 101, pp.247-261.
[3] Shi, J. and Malik, J., 2000. Normalized cuts and image segmentation. IEEE Transactions on pattern analysis and machine intelligence, 22(8), pp.888-905.
[4] Ng, A.Y., Jordan, M.I. and Weiss, Y., 2002. On spectral clustering: Analysis and an algorithm. In Advances in neural information processing systems (pp. 849-856).
[5] Aminikhanghahi, S. and Cook, D.J., 2017. A survey of methods for time series change point detection. Knowledge and information systems, 51(2), pp.339-367.
[6] Colin-Koeniguer, E., Boulch, A., Trouve-Peloux, P. and Janez, F., 2018, June. Colored visualization of multitemporal SAR data for change detection: issues and methods. In EUSAR 2018; 12th European Conference on Synthetic Aperture Radar (pp. 1-4). VDE.
[7] Conradsen, K., Nielsen, A.A., Schou, J. and Skriver, H., 2003. A test statistic in the complex Wishart distribution and its application to change detection in polarimetric SAR data. IEEE Transactions on Geoscience and Remote Sensing, 41(1), pp.4-19.